How to use pgbench to test PostgreSQL® performance
- 5 minutes read - 1031 wordsTesting a database performance is a must in every company. Despite everyone’s needs beings slightly different, a good starting point for PostgreSQL® database is using pgbench: a tool shipped with the PostgreSQL installation that allows you to stress test a local or remote database. This blog post showcases how to install (on a Mac) and use pgbench to create load on a remote PostgreSQL database on Aiven.
Install pgbench locally
In a Mac, pgbench comes with the default PostgreSQL installation via brew. Therefore to have pgbench all you need is to:
brew install postgresql
Create a test PostgreSQL environment
While you could create a test PostgreSQL environment locally (the 1brc challenge blog post contains all the details), this time we’ll create an Aiven for PostgreSQL service in minutes:
- Navigate to Aiven Console
- Create an account
- Create an Aiven for PostgreSQL service on your favorite cloud provider and region
- Select the
startup-4plan, it will be sufficient for the test.
Use pgbench to load test the a PostgreSQL database
The Aiven for PostgreSQL database comes with a defaultdb database we can use for our testing.
Step 1: Initialize the database
All we need is to grab the connection details from the Aiven Console and we are ready to initialize the database with:
pgbench -h <HOST>       \
    -p <PORT>           \
    -U <USER>           \
    -i                  \
    -s <SCALEFACTOR>    \
    <DBNAME>
Where:
<HOST>is the database hostname<PORT>is the database port<USER>is the database user<DBNAME>is the database nameSCALEFACTORis the test scale factor,100could be a good place to start. The default is1which will create a16MBdatabase, the100scale will create a1.6GBdatabase.
We’ll be prompted to write the password, that we can find in the Aiven Console.
Note: You can automate the flow without the need to include the password by storing it in the
PGPASSWORDenvironment variable withexport PGPASSWORD=<PASSWORD>and then rerun thepgbenchcommand above.
After this pgbench will execute some work including the following tables:
       Name       | nr_rows
------------------+---------
 pgbench_accounts | 10000000
 pgbench_branches |      100
 pgbench_history  |        0
 pgbench_tellers  |     1000
Step 2: execute a first test to set the baseline
After creating the dataset, it’s time to define the performance baseline (a.k.a how much does my database perform under current conditions). Let’s create one with:
pgbench  -h <HOST>                  \
    -p <PORT>                       \
    -U <USER>                       \
    -c <NUMBER_OF_CLIENTS>          \
    -j <NUMBER_OF_PGBENCH_THREADS>  \
    -t <NUMBER_OF_TRANSACTIONS>     \
    <DBNAME>
Where:
<NUMBER_OF_CLIENTS>is the number of clients to connect to PostgreSQL with, a good starting point is20<NUMBER_OF_PGBENCH_THREADS>is the number pf pgbench threads to run concurrently<NUMBER_OF_TRANSACTIONS>is the overall number of transactions to execute
The following code will execute 1000 transactions using 5 parallel threads and 5 clients
pgbench  -h <HOST>      \
    -p <PORT>           \
    -U <USER>           \
    -c 5                \
    -j 5                \
    -t 1000             \
    <DBNAME>
The result is the following:
pgbench (16.1, server 16.2)
starting vacuum...end.
transaction type: <builtin: TPC-B (sort of)>
scaling factor: 100
query mode: simple
number of clients: 5
number of threads: 5
maximum number of tries: 1
number of transactions per client: 1000
number of transactions actually processed: 5000/5000
number of failed transactions: 0 (0.000%)
latency average = 180.179 ms
initial connection time = 164.343 ms
tps = 27.750256 (without initial connection time)
Showcasing that we are generating almost 28 transactions per second (tps in the above one) from my laptop sitting in Verona to a database sitting in Turin!
Step 3: change parameters and validate the new performance
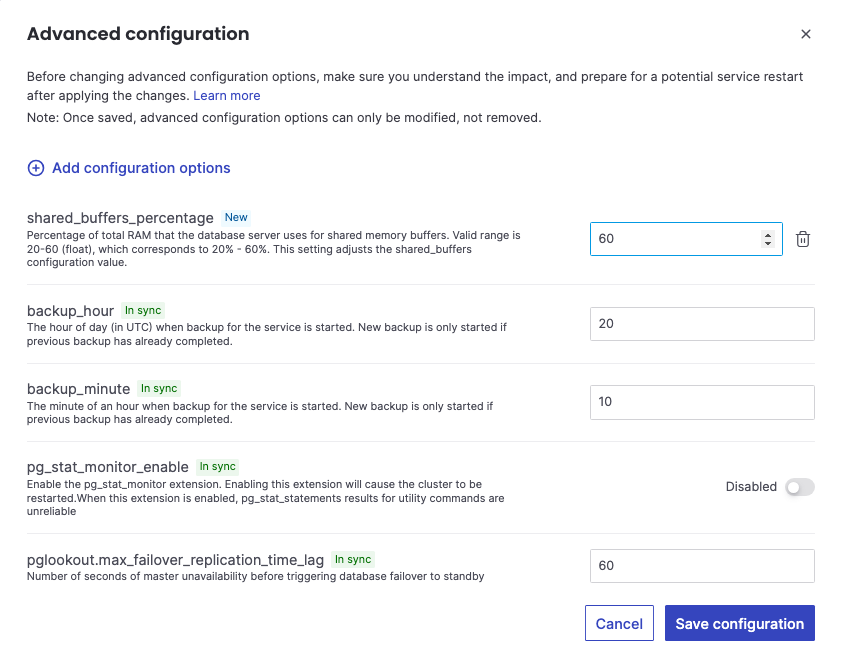
What could we change? We could increase the percentage of total RAM dedicated to shared buffers to 60% by going in the Aiven Console selecting the PostgreSQL service, selecting the Service settings menu and clicking on the Configure button next to the Advanced configuration section.

Now, if we try with the same pgbench command:
pgbench  -h <HOST>      \
    -p <PORT>           \
    -U <USER>           \
    -c 5                \
    -j 5                \
    -t 1000             \
    <DBNAME>
We get updated results with 36 tps.
Step 4: define you custom workload in a SQL file
You can customize the type of queries pgbench will execute based on your workloads. All you need to do is to define a SQL file and call it with pgbench -f flag. Let’s create a file named test.sql with:
\set r1 (random(1, 2000))
select * from pgbench_accounts where bid = :r1;
In the above we are setting a r1 variable with a random number between 1 and 2000 and then use it to query the pgbench_accounts table for rows with bid equal to r1.
We can now execute the custom sql file with:
pgbench  -h <HOST>      \
    -p <PORT>           \
    -U <USER>           \
    -c 5                \
    -j 5                \
    -t 1000             \
    -f test.sql         \
    <DBNAME>
In our example the above produces the following output:
scaling factor: 1
query mode: simple
number of clients: 5
number of threads: 5
maximum number of tries: 1
number of transactions per client: 100
number of transactions actually processed: 500/500
number of failed transactions: 0 (0.000%)
latency average = 10514.270 ms
initial connection time = 245.617 ms
tps = 0.475544 (without initial connection time)
A miserable 0.47 transactions per second. Can we do better?
Step 5: Optimize your database
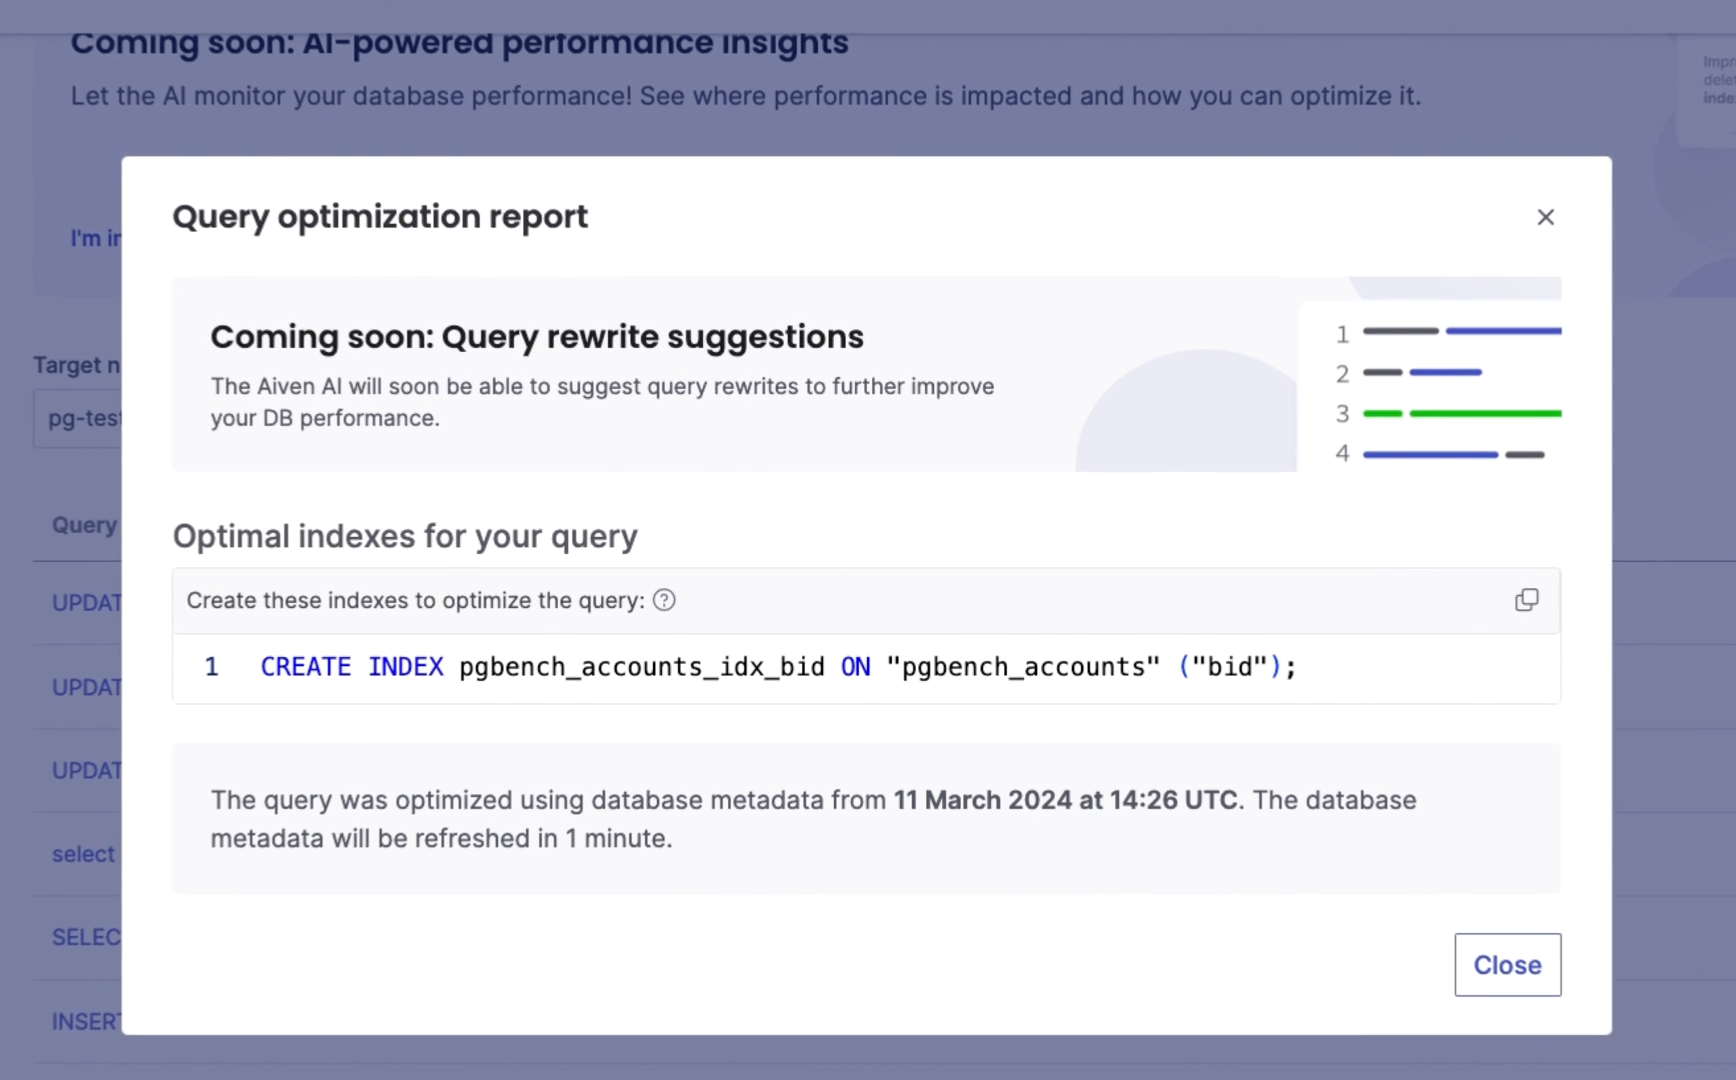
Once you took time to write a custom workload to test with pgbench and got a baseline, it’s time to optimize your database. You could do it based on your knowledge and available data but, if you are using Aiven, you can receive automated insights about your PostgreSQL database workload and index and (in the future) SQL optimization suggestions. Check out the video below!
In our case, Aiven will suggest to add an index on the bid column.

CREATE INDEX pgbench_accounts_idx_bid ON "pgbench_accounts" ("bid");
After creating it, and retrying the pgbench command above, the custom workload speed raised from 0.45 to 35 transaction per second.
Conclusion
pgbench is a great tool to perform performance checks on your PostgreSQL database and the custom script option provides a way to customize it to match your workloads. Used with Aiven and its AI insights is a great way to test and optimize your database!